Data
Get instant insights into your streets’ traffic.
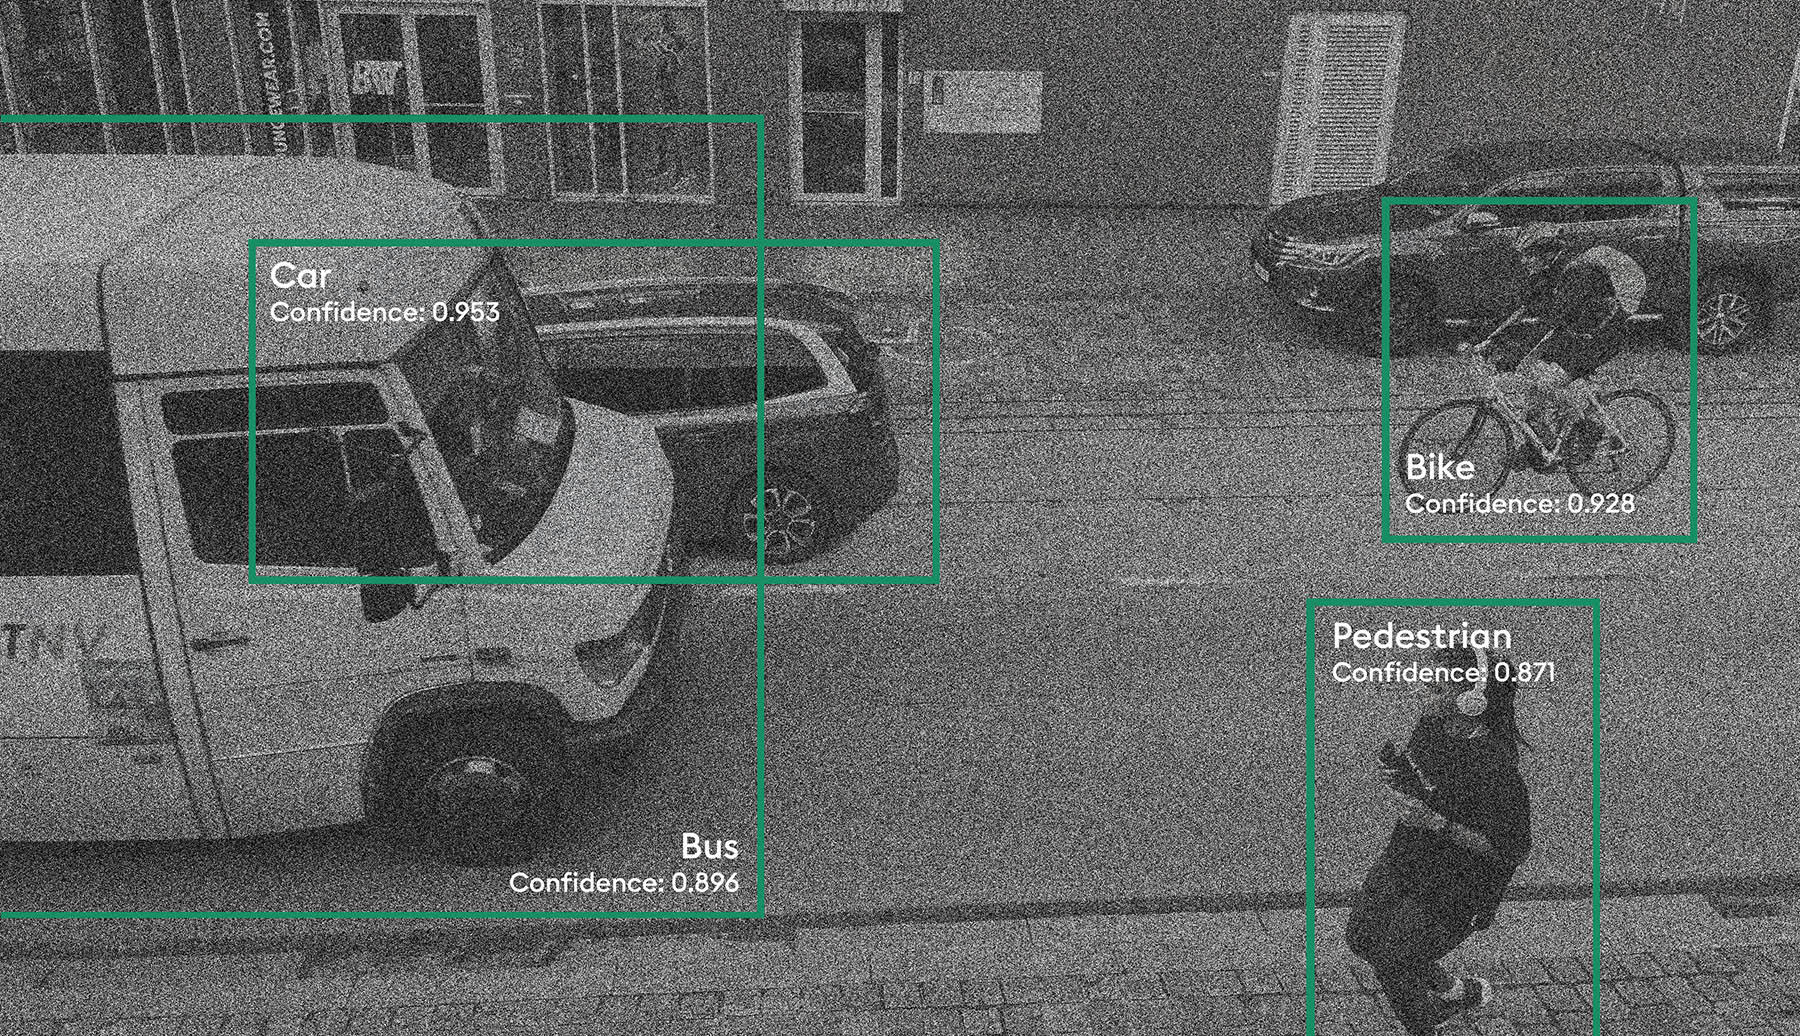
Get car, bike, pedestrian, heavy vehicles count and more!
Get car, bike, pedestrian, heavy vehicles count and more!
Basic dataAccessible with
free subscription |
Advanced dataAccessible with
premium or network subscription |
|
| ON THE PUBLIC PAGE Available to everyone |
||
| Counts & travel direction for 4 categories | ||
| Night counts | ||
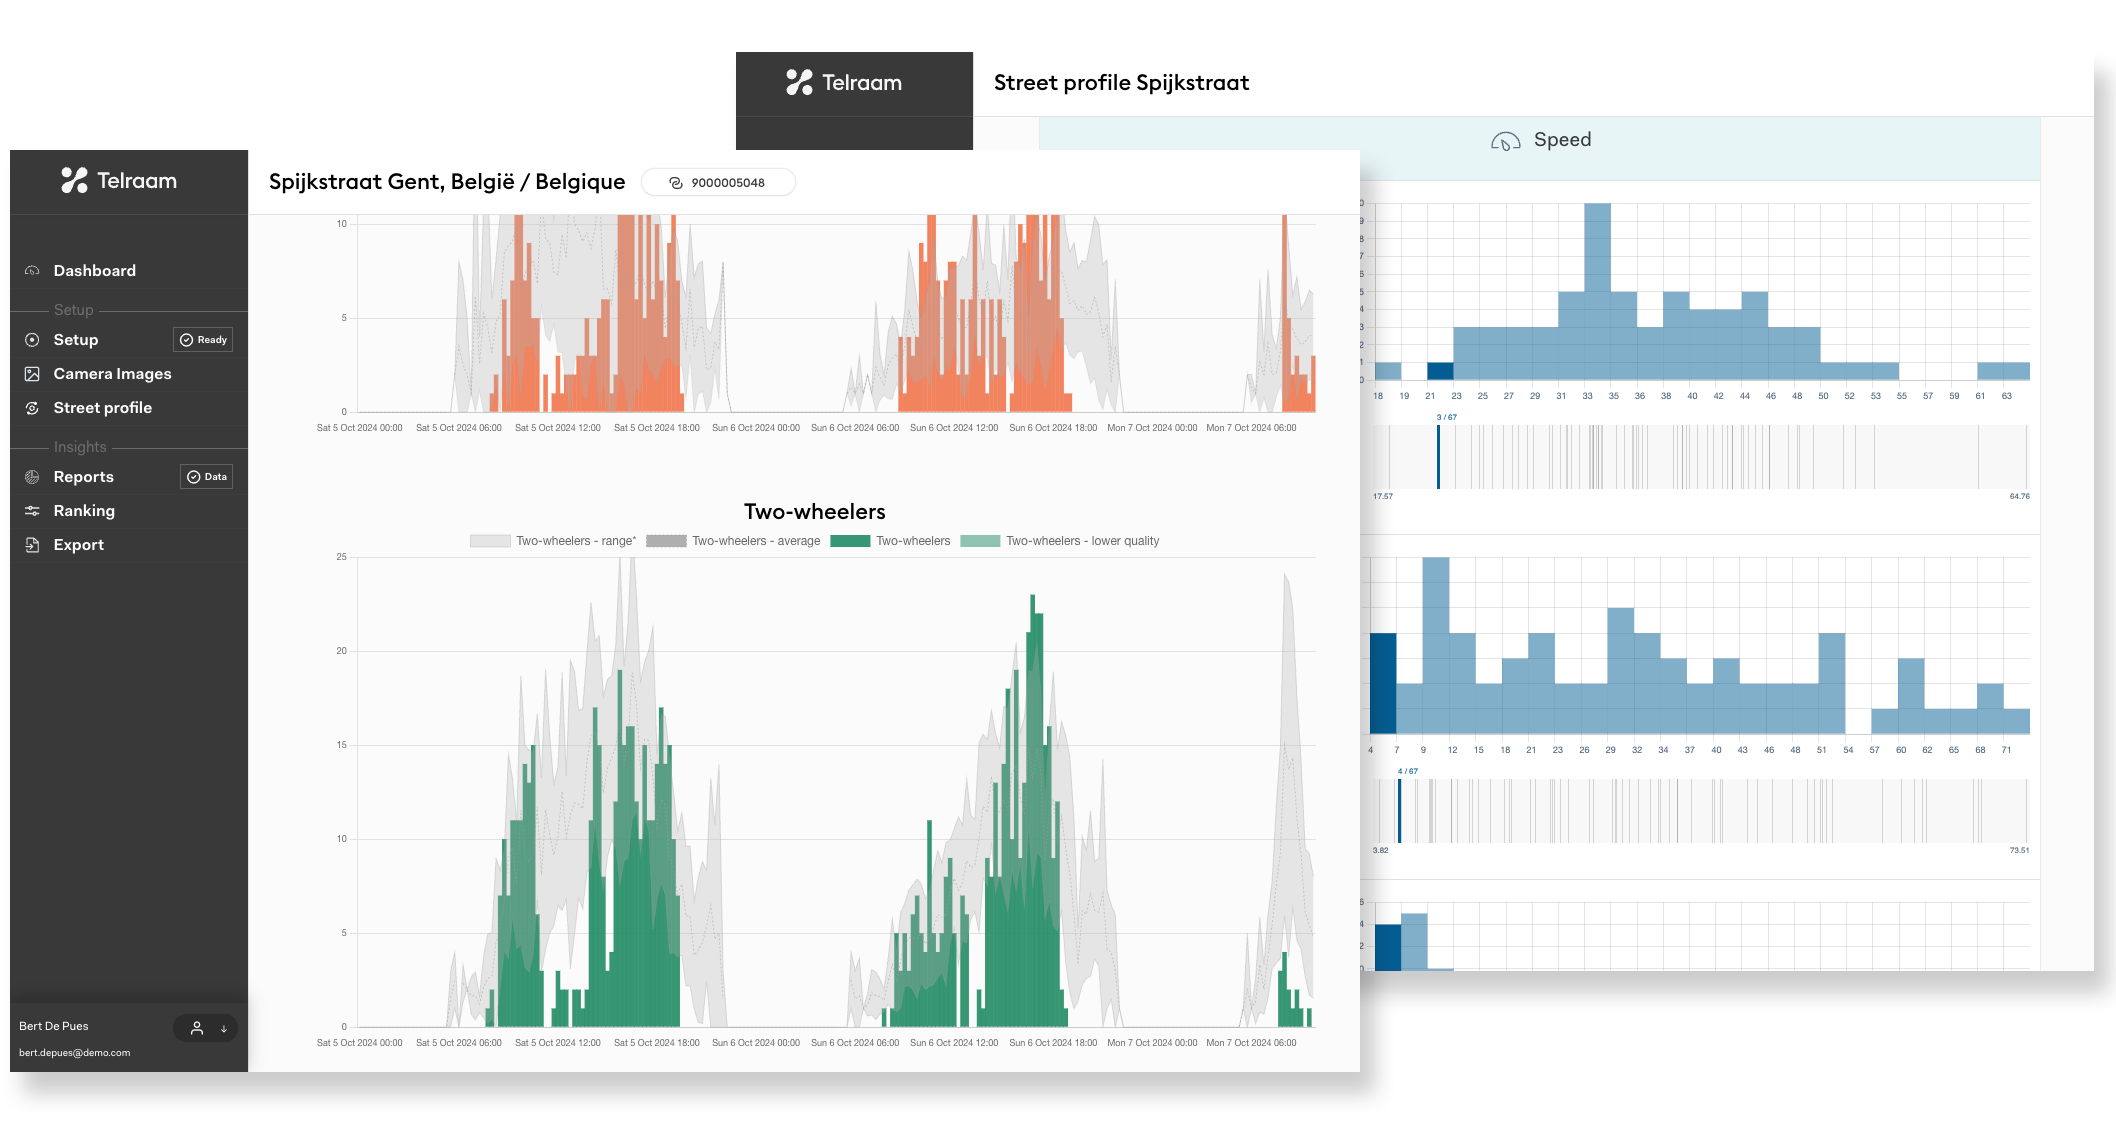
| Daily and hourly overviews, speed, modal split | ||
| Ranking | ||
| IN YOUR PERSONAL DASHBOARD Available to device owners |
||
| Flexible data range selection | ||
| Monthly traffic report | ||
| Export raw data | ||
| Counts & travel direction for 10 categories | - | |
| Trends | - | |
| 15 minute resolution data | - | |
| Data per installation When multiple Telraam devices are installed on one segment, the public page shows an average. Advanced data access allows viewing data exclusively from your device in your reports. | - | |
| Street Sheet report | - | |
| Basic API access | - | |
| Advanced API access | - | |